Abstract
Introduction: Heterogeneity exists in prognosis of Angioimmunoblastic T-cell lymphoma (AITL) patients. Thus, a personalized prognostic model is crucial for survival prediction for each AITL patient. Nomogram is a powerful mathematical tool to predict survival. In this study, we aimed to develop a prognostic nomogram for AITL based on data from a large clinical database and validate it in an independent external cohort. In addition, we compared the accuracy of the nomogram with previous prognostic models used in AITL including International Prognostic Index (IPI) and Prognostic Index of T-cell lymphoma (PIT) model.
Methods: Totally, 1071 patients were retrieved from the Surveillance, Epidemiology, and End Results (SEER) database as the training cohort; 156 patients diagnosed from 2009-2021 in Sun Yat-Sen University Cancer Center or The First Affiliated Hospital of Guangzhou Medical University were recruited as the external validation cohort. 105 patients with IPI information in the training cohort were used to compare the nomogram and IPI. 156 patients in the external cohort were used to compare the nomogram and IPI or PIT. The Prognostic risk factors in the nomogram were identified by cox proportional hazards model. Concordance index (C-index) and calibration curves were used for internal and external validation. C-index and decision curve analysis (DCA) curves were used to compare the models.
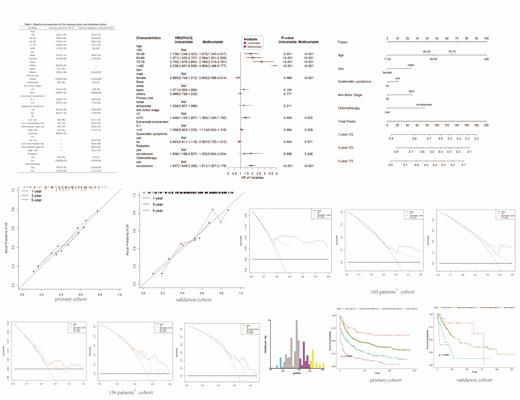
Results: Age, sex, systematic symptoms, Ann Arbor stage and chemotherapy were risk factors finally included to develop the nomogram. C-indexes of the nomogram were 0.676 and 0.652 in the training cohort and the validation cohort. Favorable agreement of nomogram-predicted and actual probability of overall survival (OS) was detected by calibration curves in both training and validation cohorts. In the cohort of 105 patients, C-indexes of the nomogram and IPI were 0.696 vs 0.616 (P<0.05); in the cohort of 156 patients, C-indexes were 0.652 vs 0.597 (P=0.08) of the nomogram and IPI while 0.652 vs 0.616 (P=0.176) of the nomogram and PIT. Decision curve analysis (DCA) showed superiority of the nomogram as compared with the IPI or the PIT model in both 105 and 156 patients' cohorts. A web calculator was published for convenient clinical application. Based on the prognostic scores calculated by the nomogram, three cut points were identified by X-tile program to establish a classification system that could significantly distinguish patients in four risk groups.
Conclusion: We establish a nomogram for survival prediction of AITL, which may assist in treatment strategy making and survival consultation.
No relevant conflicts of interest to declare.


This feature is available to Subscribers Only
Sign In or Create an Account Close Modal